Data visualization through charts, dashboards, or data grids is a critical task of enterprise IT, business, and data analyst teams. As most enterprise data is stored in relational databases, let's explore how to create SQL dashboards and data grids using Five.
Charts and dashboards are often the first steps that businesses take toward more advanced business intelligence (BI) or data sciences.
Data grids are an Excel-like view of the data contained in a SQL database. They give end-users an easy and intuitive way to work on their data in a tabular format.
This blog post explains how to visualize data stored in a MySQL database by building a web application with forms, charts, dashboards, and data grids using Five's low-code IDE.
What is Five?
Typical applications built with Five are operations software or business applications designed to store, update, process, analyze or visualize data stored in a MySQL database.
Applications built with Five are responsive and can be accessed from any device. Through Five's in-built authentication features or Single-Sign-On (SSO), developers can govern application access and permissions, making sure that data is only exposed or accessible to selected user groups.
Using Five For SQL Visualizations & Data Processing
Five offers several ways to store, process and visualize data:
Create and Manage a MySQL Database. Inside Five, developers can visually create a cloud-hosted MySQL database, and its tables, fields, and relationships. Instead of having to connect to an external MySQL database, every application developed with Five comes with an integrated MySQL database that developers can create and manage using Five's table wizard or database modeler.
Build or Write SQL Queries using Five's Query Editor. Inside Five, developers can query the data stored in their MySQL database. Five lets developers build and write queries using Five's visual SQL editor. Data from queries can be served to the front end in real time through Five's use of Webhooks.
Create Charts. Inside Five, developers can select from a library of out-of-the-box charts for MySQL data visualization. Five's chart library includes the most common chart types, such as bar, line, or radar charts.
Combine Charts and Reports into Dashboards. Developers can define a UI grid to place charts and reports to build custom dashboards.
Filter and Query Data as Data Consumers. End-users who consume the data through the finished application can search and filter their data. Five provides pre-built features for end-users to do so. Five also lets end-users export data to CSV.
How is Five Different From Pure-Breed Data Visualization Tools?
Five, on the other hand, is a low-code development environment for creating feature-rich web applications. Applications built with Five come with a MySQL Database, and can contain forms, dashboards, in-app notifications, or multiple user roles and permissions. SQL dashboards and visualizations are but one of Five's application development features.
In an application built with Five, end-users can be assigned Create, Read, Update, and Delete (CRUD) permissions.
To use a simple example: say, you want to build a lead-generation web application with the following functionality:
Consumers can sign up for your services using a form that is accessible on a public URL.
Your sales team gets notified by email every time someone signs up and can process consumers' information inside the same application.
Management has a dashboard that tracks daily sign-ups in real time.
How is Five Different From React Data Grid?
Five's data grid comes with the same controls that you would expect from the React Data Grid, such as
Custom sorting
Editing
Create - Read - Update - Delete (CRUD) data from inside the grid
Pinning a column to the left or right
Hiding columns
Using different display types natively inside the data grid, such as date or time pickers
Adding functions and events into the grid, such as a calculation that is automatically performed when a user enters a cell of the grid.
a cloud-hosted MySQL database,
development, testing, and production environments,
a JavaScript & TypeScript code editor, as well as many others.
Using Five to Analyze and Visualize MySQL Data
Forms, drill-downs, and Filters
Reports & Charts
Dashboards
Data Grids
Sign up and download Five for free from our website, and
We will primarily work with two tables in this diagram: the Portfolio and the Buy table. For now, simply note that a portfolio can have several buy transactions. Also note, that the application's database was created using Five's table wizard and visual database modeler.

1. Forms and Filters
Portfolio Buy
Forms, drill-downs, and filters are Five's most basic building blocks for your end-users to interact with your database.
To explore Five's user interface and how it displays forms, drill-downs, and filters, follow these steps:
Launch the Portfolio Application.
Click on Portfolios \> Growth Portfolio > Down Arrow. You have just drilled down into your Growth Portfolio. Note how in the top navigation bar, your end-users can now see the drill-down: Home > Portfolios (Growth Portfolio) > Buys.
Click on Buys to see the buy transactions that are related to your portfolio. Click on any of the buy transactions, let's say BHP. The form on the right now displays all information that pertains to this buy transaction.
To filter your data, click on the Filter icon inside the search bar. Five lets you filter your data based on multiple dimensions.
Of course, you can also perform simple text searches using the Search Bar.
To see these features in action, check out this video:
2. Reports & Charts

Launch the Portfolio Application,
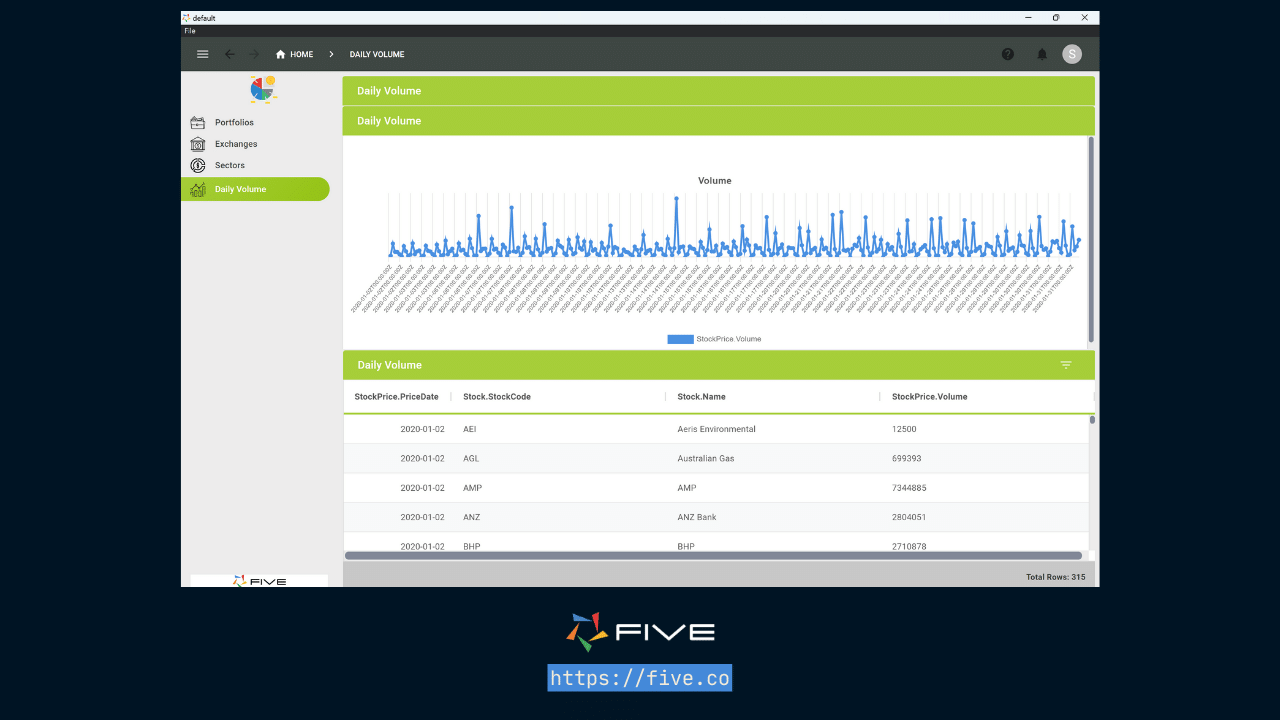
Click on Daily Volume in the menu on the left. The Daily Volume shows a line chart at the top and a report at the bottom.
Note how by using the Filter icon, your end-users can filter the report at the bottom.
3. SQL Dashboards
The Daily Volume dashboard has one column and two rows. Inside of Five, we can define a custom grid for our dashboard and position charts or reports as per end-users' requirements in this grid.
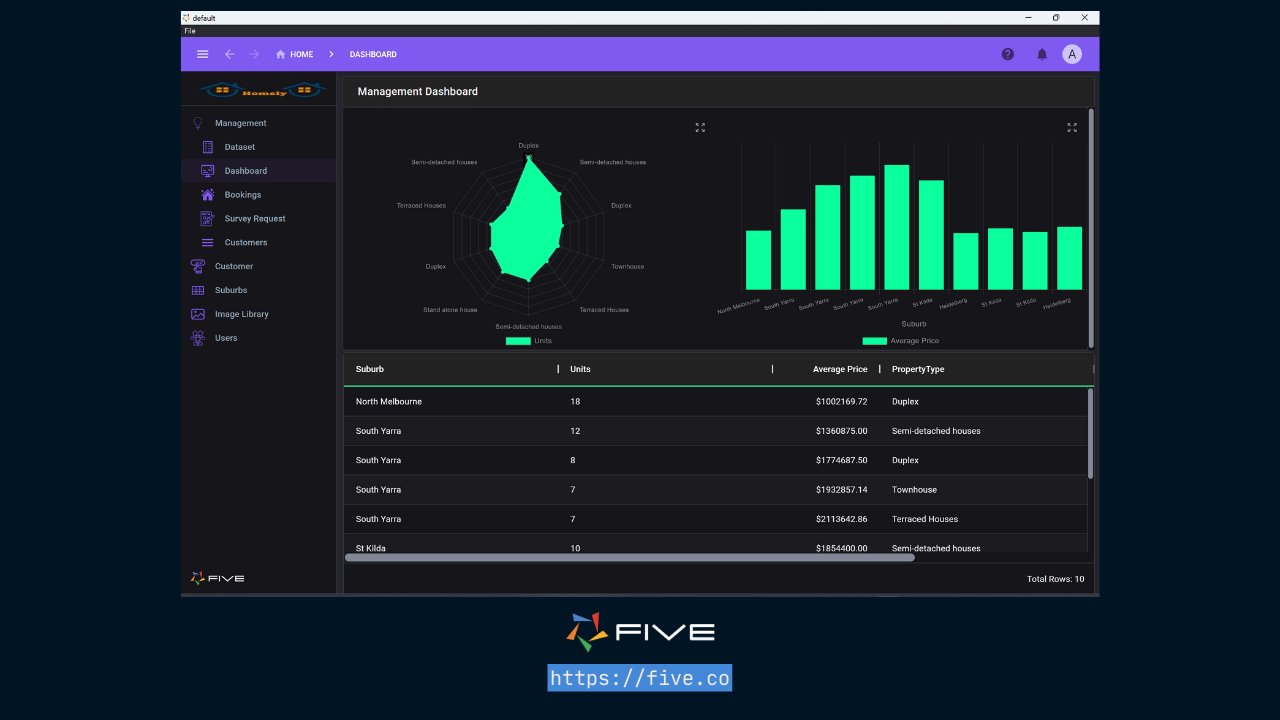
Here is another example of a dashboard built with Five. Here our developers built a dashboard with two columns and two rows. We used a radar and a bar chart in the upper row. In the lower row, we only placed one report. And, of course, we created a cool dark theme for this particular dashboard.

4. Data Grids
The data grid is a frequently-asked-for feature request by application end users. Popular design libraries such as React and Material-UI offer Data Grids as a UI component.
In Five, developers can create a data grid as a page inside a form. No custom code is required to add data grids to your forms.
To understand how a data grid looks to the application's end-users, watch the video below. In it, we have developed a simple two-table application that shows members by location. For each location, we can view all its members in a data grid.
Data grids are typically used to perform quick sanity tests on data. Instead of having to click through forms, the data stored in your SQL database is shown straight on the end-user's front end, the same way they would see it if it were stored in a spreadsheet.
To learn how to build a data grid, visit our user community and follow the steps.
Conclusion: SQL Dashboards & Data Visualization
stored in a clean and consistent manner
Starting from simple forms that can be filtered or searched by application users, we explored
charts,
reports
dashboards, and
Five's editable data grid.
Beyond application development, Five also offers one-click deployment features. Developers can build and test their applications locally by using Five's free download. To launch applications to Five's managed cloud, sign up for a paid subscription on our website.
To start building, sign up here.
